
InsForge now has a Backend Health view in the dashboard — Observability and Backend Advisor, live in every project.
Observability
Every InsForge project runs on a dedicated EC2 instance. The dashboard now exposes its real-time signals as first-class cards on the project page — no SSH, no agent install, no separate metrics stack.
- Five metrics: CPU usage, memory usage, disk usage, network in, network out.
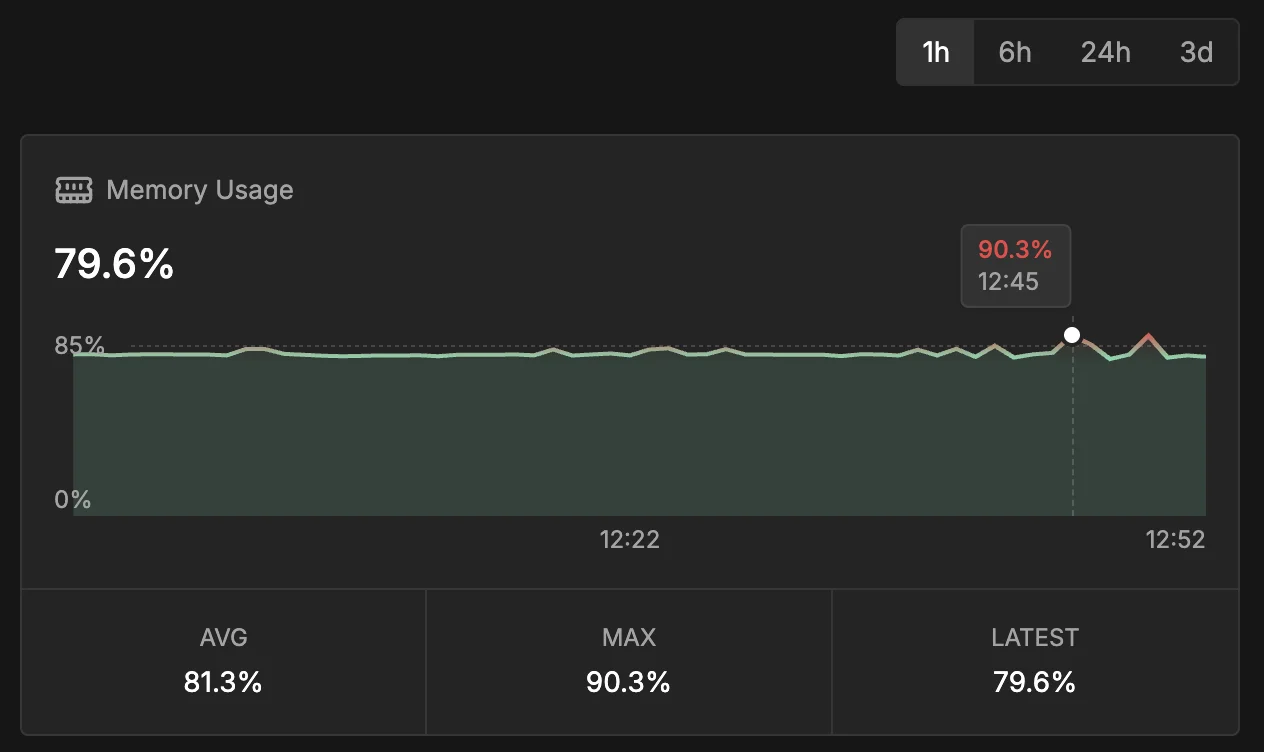
- Four ranges: 1h, 6h, 24h, 3d, switchable in one click.
- Threshold gradients: cards transition from neutral to red as CPU crosses 60%, memory crosses 85%, and disk crosses 90%.
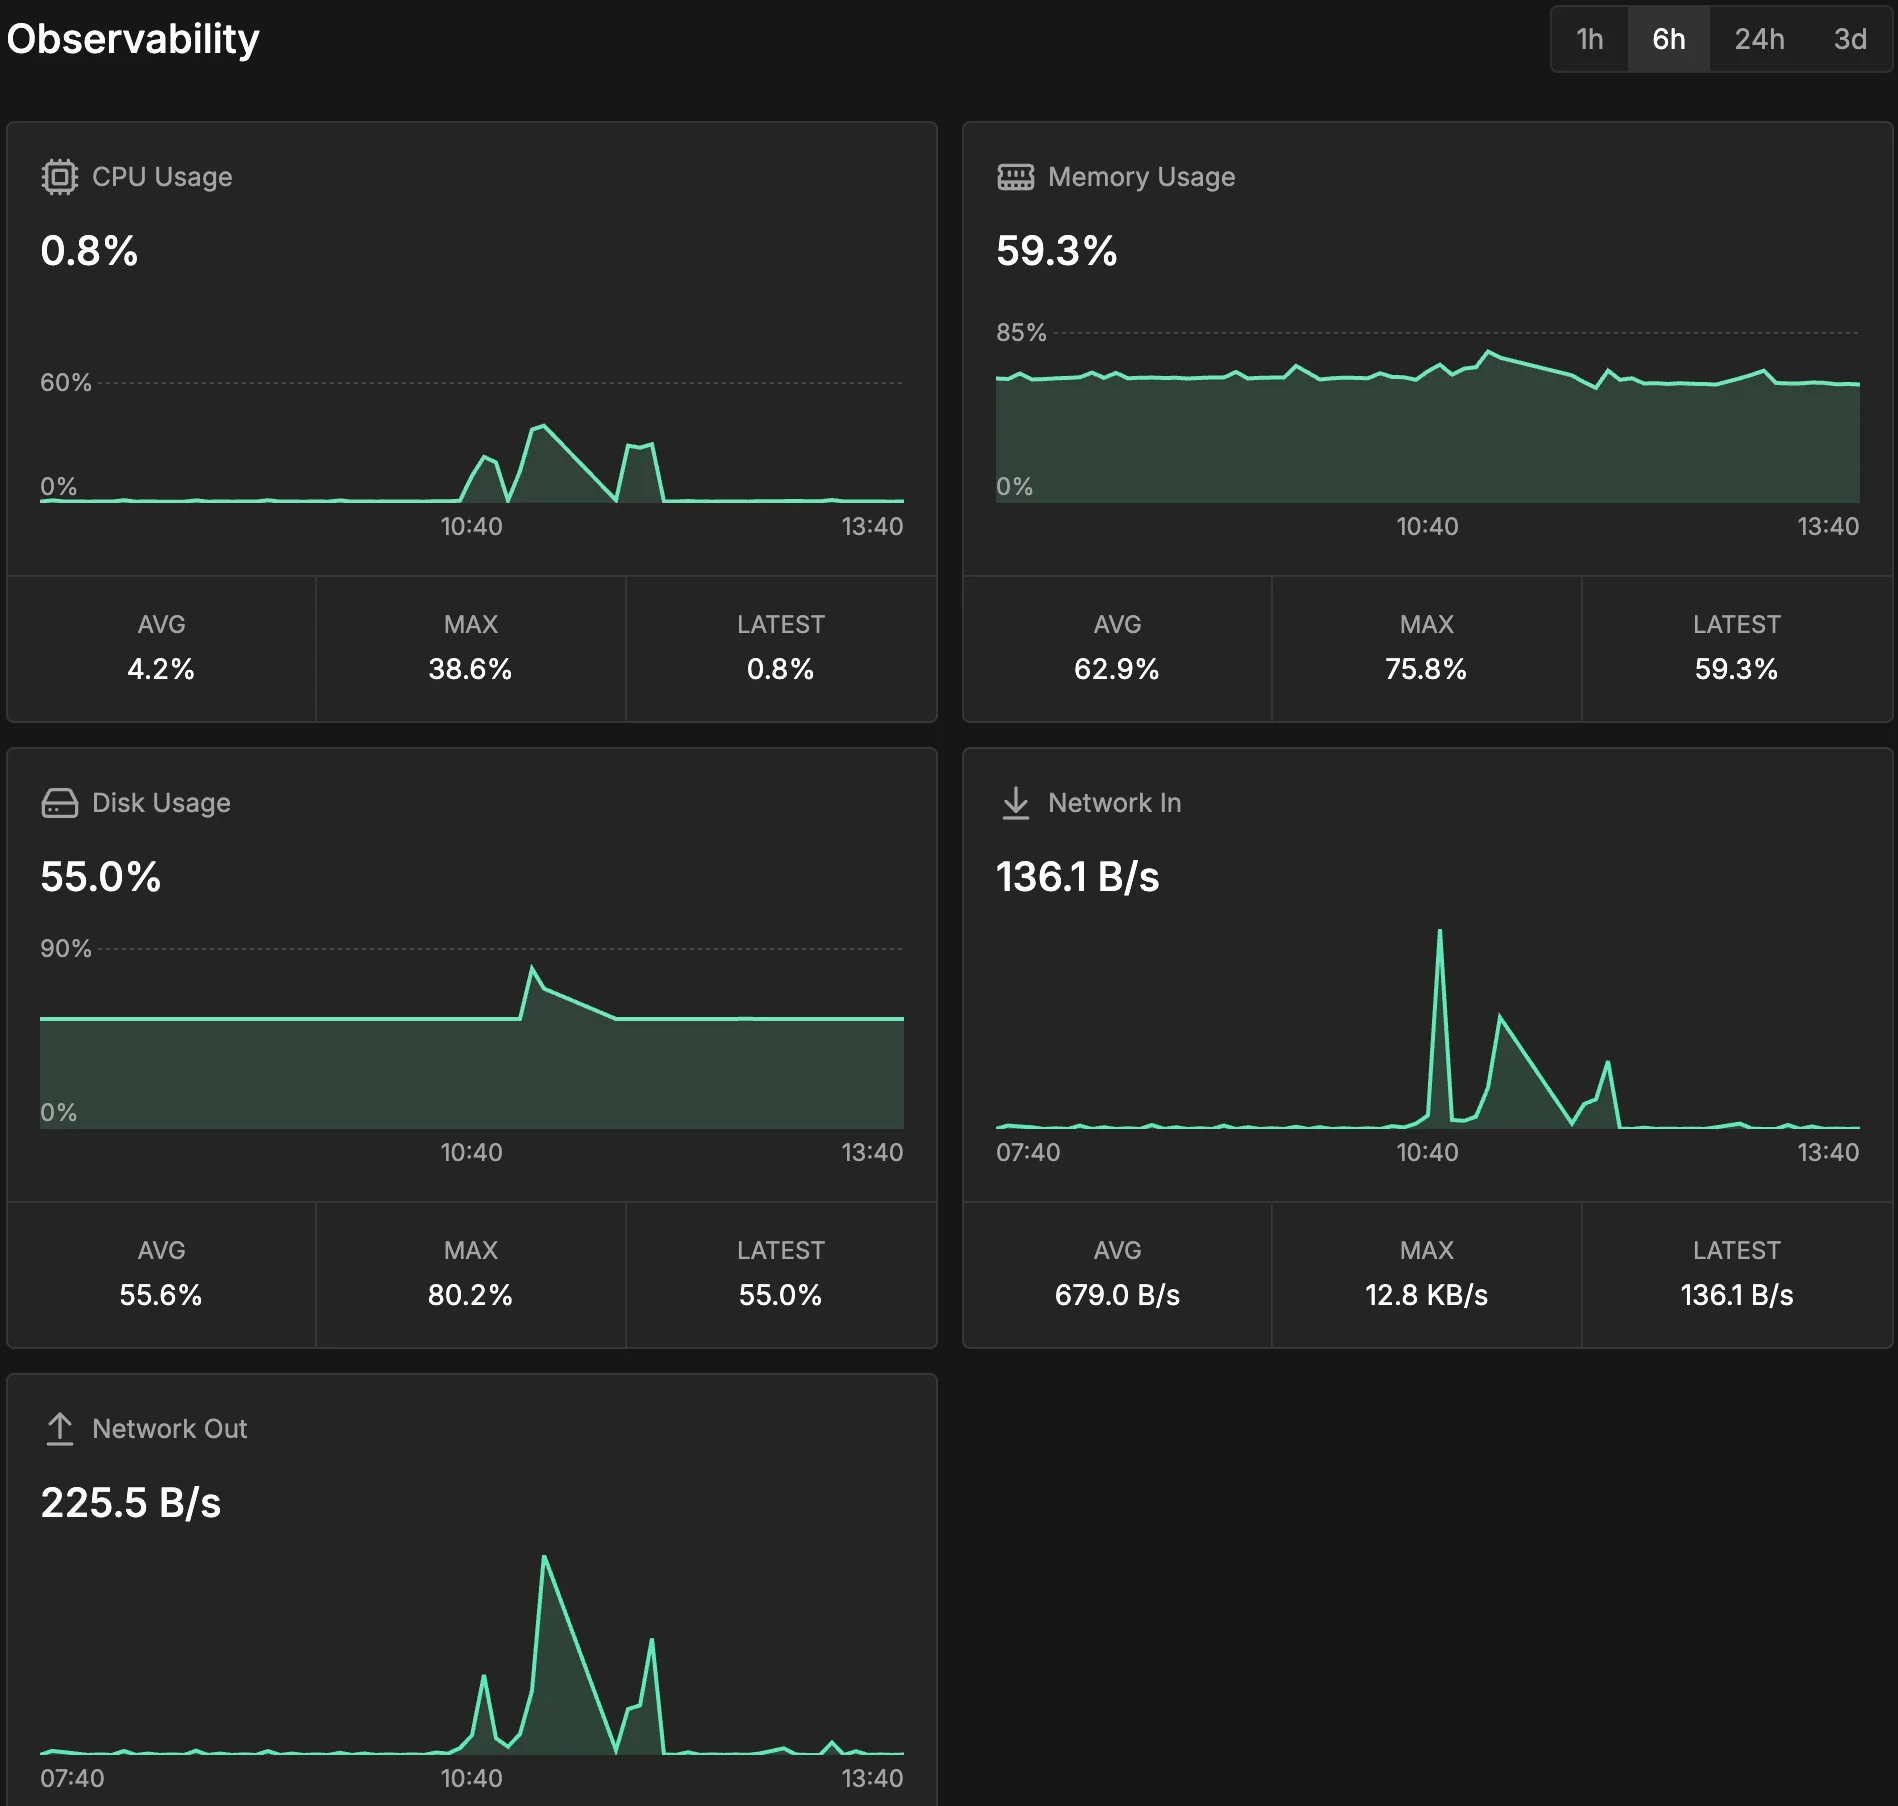
The gradient is the point. A glance at the dashboard tells you whether anything is hot, before you read a single axis label.
Backend Advisor
Backend Advisor scans every active project daily across security, performance, and health. We surface findings inline in the dashboard — no separate report, no email digest to chase down.
- Severities:
critical,warning,info— filterable from a dropdown. - Categories: tabbed by area, each with its own count.
- Re-scan: trigger a fresh scan from the section header; results poll in within 30 seconds. Last scan time sits next to the title so you always know how stale the view is.
- Copy All: pull every finding currently displayed onto your clipboard as one batched prompt.
- No-scan empty state: a fresh project shows "No scan yet" with a direct prompt to run the first scan.
- Retention: findings stay for 30 days; resolved issues drop off automatically on the next scan.

The scan looks for concrete patterns: slow queries above 1s, connection pools past 80%, unused indexes older than a week, low cache hit ratios, dead tuple bloat, sequence exhaustion, autovacuum blockers, and security misconfigurations like missing RLS policies on public tables.
Click any row to expand the finding — the rule that fired, the affected resource, the description, and the exact remediation. Each expanded card surfaces a Copy Remediation button, and that is where the AI-agent piece lives.

Copy Remediation as a Prompt
The Copy Remediation button does not put a sentence on your clipboard — it puts a full agent prompt: severity and category in the header, then the rule ID, the affected resource, the human-readable description, and a ready-to-run remediation snippet.
Paste into Cursor, Claude Code, or any agent shell and the agent has everything it needs to apply the fix without re-investigating the issue. The header Copy All copies every visible finding as one batched prompt — useful right after a fresh scan when there are several criticals to clear at once.
CLI Still Works
We kept the CLI as the way to script diagnostics into CI or local agent loops:
npx @insforge/cli diagnose advisor --severity critical
npx @insforge/cli diagnose metrics --range 1h
Read the CLI launch post for the full diagnose workflow and the companion insforge-debug agent skill.
Get Started
- Open the Dashboard tab on any InsForge project — Observability and Backend Advisor sit at the top.
- InsForge docs
- insforge-debug agent skill
- Star us on GitHub