
$ ssh ec2-user@10.0.100.39
Last login: Wed Jul 15 10:05:00 2026
[ec2-user@ip-10-0-100-39 ~]$
This is the command to hop onto an AWS EC2 instance: a rented virtual machine (VM) that stays on, so your app doesn't die when your laptop lid closes.
Every backend ultimately lives on a virtual machine like this. You can choose to rent it yourself from cloud providers like AWS, Azure, or GCP, or use a platform like InsForge, Supabase, or Railway that rents it for you.
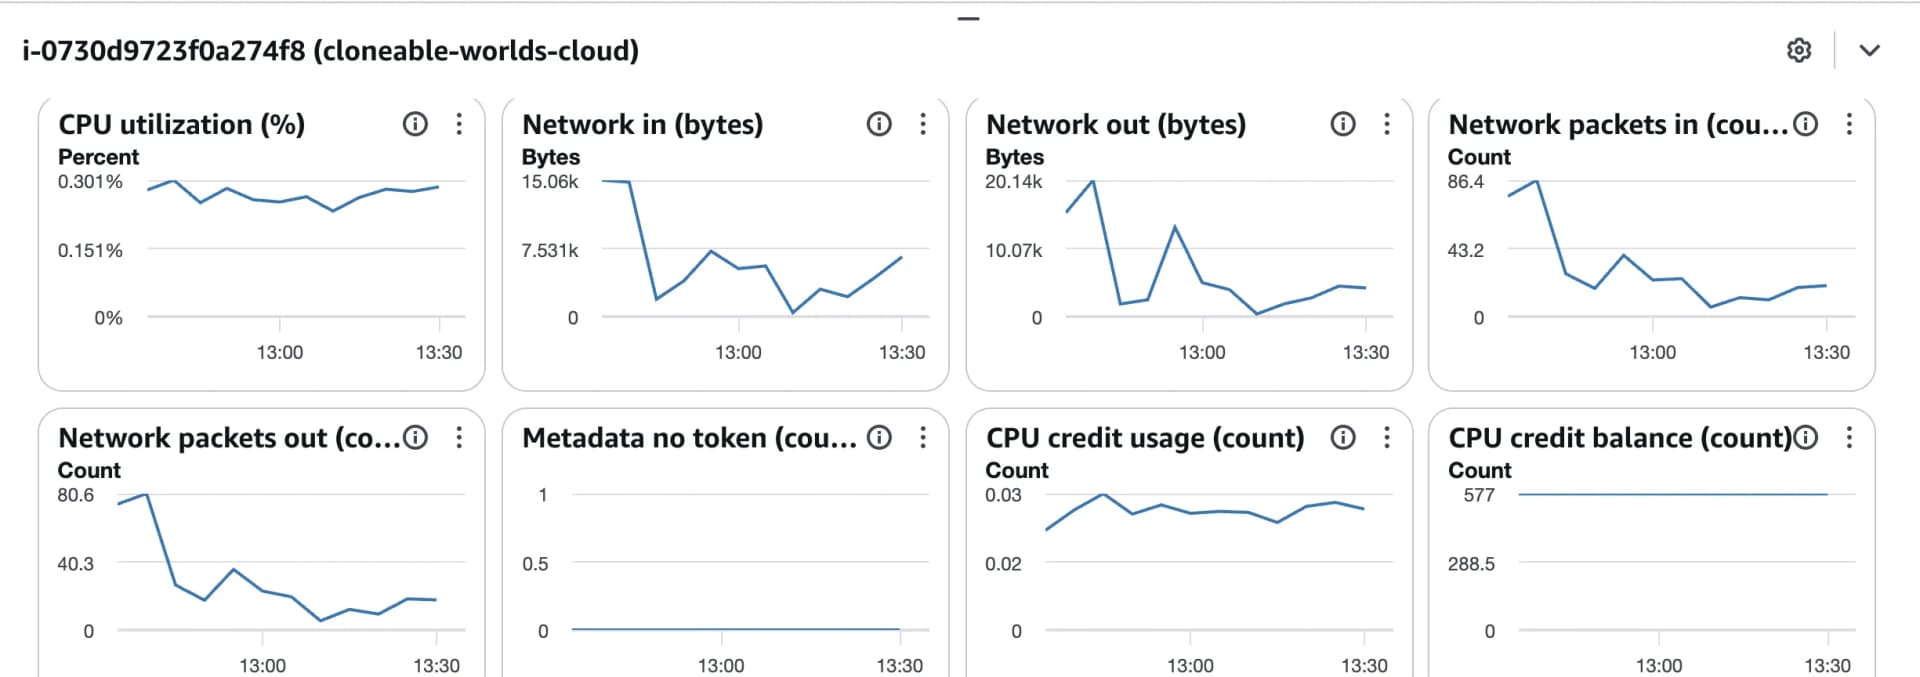
These platforms give you clean dashboards that are perfect for human observability. But a summarized graph is for humans, not agents. Your AI agent isn't glancing at a screen — hand it a dashboard screenshot and it will be guessing at pixels. Instead, you can give the agent host access and let it run a command, read the exact numbers the machine reports, and act on them. Raw metrics are the interface agents actually want. This post walks through the handful of commands your agent should reach for to read an instance's identity, CPU, memory, and disk — and what each output really means.
1. Identity: which machine am I even on?
$ hostnamectl
         Chassis: vm 🖴
  Virtualization: amazon
 Hardware Vendor: Amazon EC2
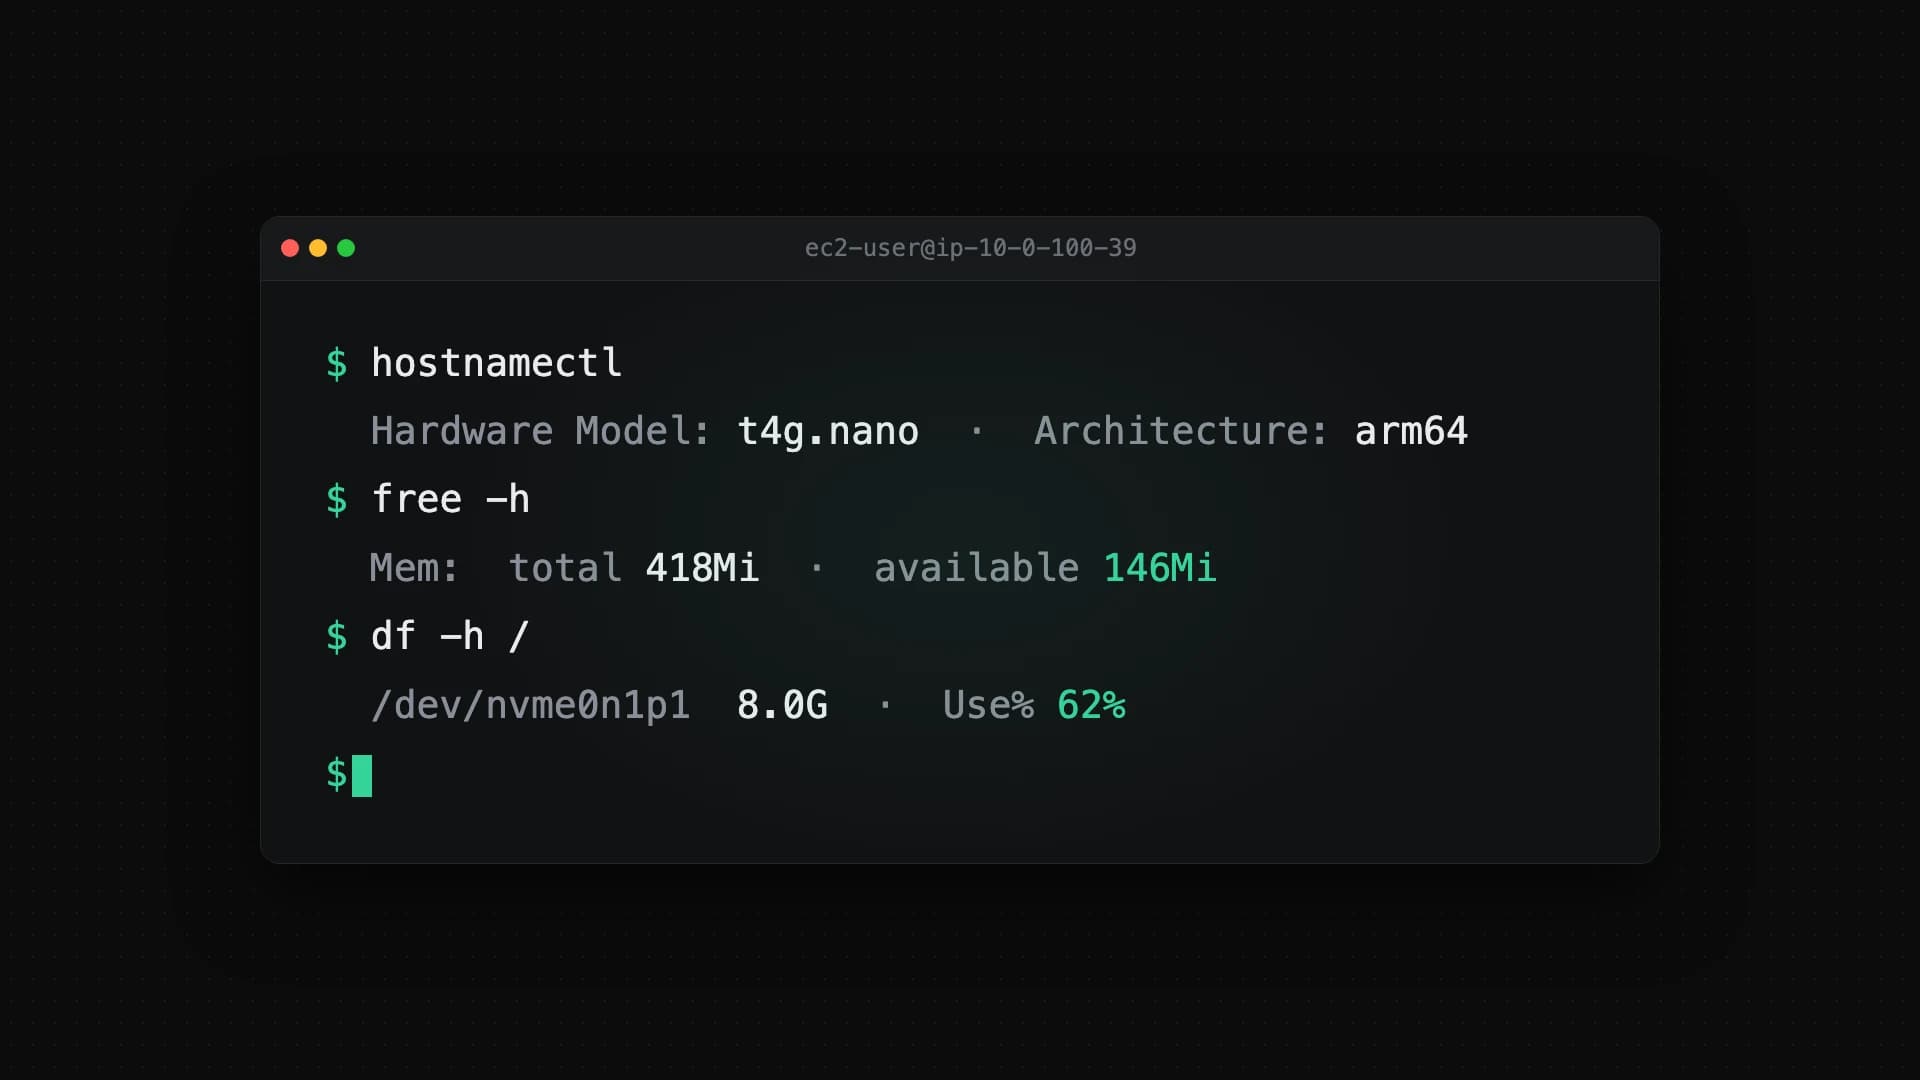
  Hardware Model: t4g.nano
    Architecture: arm64
hostnamectl is a Linux command that shows the basic identity of the machine you're on.
Here, we can see it's on AWS, running under Amazon's virtualization, on arm64. This gives you useful metadata about the OS/architecture (arm64) and its vendor in case there are upstream service failures (which can happen during data center outages). For an agent this is the first read: arm64 tells it which container images to pull, and the vendor tells it where to look when something upstream breaks.
2. CPU
The CPU is the part of the machine that executes code: every line you ship gets broken down into primitive instructions (add, compare, load, store), processed a few billion per second. On a virtual machine you don't get the whole CPU chip. Instead, you get vCPUs: virtual cores carved out of the host's physical processor by the hypervisor.
Think of each vCPU as one independent worker. Two vCPUs means the machine can do at most two things at the same time.
Two Linux commands tell you the machine's vCPU count:
nproc— the headline number: how many cores can my programs actually use?lscpu— the spec sheet: model, cores vs threads, architecture, in human-readable form.
$ nproc
2
$ lscpu | egrep 'Model name|CPU\(s\)'
CPU(s):        2
Model name:    Neoverse-N1
So this VM has two vCPUs, and Model name tells you which CPU chip it uses.
And to see what the CPU is doing right now, run top (press q to exit):
Load Avg: 4.26, 3.36, 2.87
CPU usage: 82.4% user, 14.1% sys, 3.5% idle
Load Avg: 4.26, 3.36, 2.87— how many tasks wanted the CPU on average over the last 1, 5, and 15 minutes. So if you only have 2 vCPUs, tasks are waiting in line.CPU usage: 82.4% user, 14.1% sys, 3.5% idle— where the CPU's time goes:useris your own programs,sysis the kernel working on their behalf, andidleis unused. Here,useris doing heavy compute and the instance is barely idle — so an agent reading this can act on it: shed load, or resize to an instance with more vCPUs.
3. Random Access Memory (RAM)
RAM is the machine's short-term memory. It stores intermediate state for a compute request. For example, variables that will be used in the next line of code, database rows while they're filtered or joined, or an HTTP request while your server generates a response. Most computation happens in RAM because it's much faster than disk. However, when RAM fills up, the kernel starts using swap: think of it as local disk used as overflow memory.
One Linux command gives you the whole picture:
free -h— the summary of RAM and swap: what exists, what's in use, and what's actually left. (-hprints human-readable units likeMiandGiinstead of raw kilobytes.)
$ free -h
               total        used        free      shared  buff/cache   available
Mem:           418Mi       258Mi        14Mi       3.0Mi       145Mi       146Mi
Swap:          417Mi       217Mi       200Mi
That's a lot of values that don't immediately make sense. Most of the time you really just want to know how much memory is available to use.
Two rows: Mem is your physical RAM. Swap is the overflow area described above; a little swap usage is normal. When asking "how much is left," focus on the Mem row.
Six columns, left to right:
total(418Mi) — how much RAM exists. Not the full 512MB — the kernel and hypervisor take their cut first.used(258Mi) — actively held by running programs right now.free(14Mi) — RAM that's completely untouched. A low number here is normal: a healthy Linux box puts nearly all of its RAM to work.shared(3Mi) — memory shared between processes; usually small, usually ignorable.buff/cache(145Mi) — RAM that Linux is borrowing for disk cache to run faster. It looks used, but it's handed back the instant a program needs it.available(146Mi) — the number people actually care about. How much a new program could grab right now:freeplus everything reclaimable from cache. So the answer to "How much memory is left?" is 146Mi.
For an agent, available is the number to watch: when it runs low, it can cap new connections or flag the box before it starts swapping hard and slows to a crawl.
4. Disk
Disk is the machine's permanent storage. Unlike RAM, which is cleared when the machine restarts, disk keeps data permanently. It stores the operating system, your application's files, and databases. Because disk is much slower than RAM, programs load data into RAM to process it and write it back to disk only when necessary.
Two commands show the disk storage:
df -h— how full each filesystem is: total size, used, available, and percent used.lsblk— the drives underneath and how they're partitioned. (findmntandsudo fdisk -lgo deeper if you ever need it.)
$ df -h /
Filesystem      Size  Used Avail Use% Mounted on
/dev/nvme0n1p1  8.0G  5.0G  3.1G  62% /
$ lsblk
NAME          MAJ:MIN RM  SIZE RO TYPE MOUNTPOINTS
nvme0n1       259:0    0    8G  0 disk
└─nvme0n1p1   259:1    0    8G  0 part /
zram0         252:0    0  419M  0 disk [SWAP]
The disk is only 62% used, so there's still plenty of space left. This is the single drive the whole machine runs on, shown at two levels: nvme0n1 is the full 8 GB disk used in this VM.
zram0 listed below is the swap from the memory section. Swap counts as a block device, so it shows up in lsblk too.
At 62% there's nothing to do here. An agent watching this read can catch a disk trending toward full and expand the volume before writes start failing.
Conclusion
A dashboard is a visual summary for humans. The raw metrics underneath are complete and comprehensive. So don't stop at wiring your agent to a metrics API or handing it a screenshot. Give it a shell. Let it run hostnamectl, top, free -h, and df -h, read the real numbers, and decide what to do: resize the instance, restart the stuck service, or flag the box that's about to fall over. Teams that let their agents read the machine directly will debug faster than those that make them analyze the graphs.